
Nutritional counseling improves dietary diversity and feeding habits of Zambian malnourished children admitted in Rainbow nutritional programs
Moramarco S,1,2 Amerio G,2 Chafula Muyaba L,3,2 Bonvecchio D,1 Abramo E,1 Palombi L,1 Buonomo E.1
1 Department of Biomedicine and Prevention, University of Rome Tor Vergata, Italy
2 Rainbow Project, Association Pope John 23rd, Zambia
3 Ndola Teaching Hospital, Zambia
Introduction
The causes of childhood malnutrition are many and complex. As widely explained in the UNICEF Conceptual Framework of Malnutrition inadequate food intake (mostly poor quality diets low in calories and essential nutrients) and infections are listed as major reasons attributed to childhood malnutrition, worsened by factors such as economic status, hygiene, living conditions, medical care, parental education, and feeding practices.1 The most critical period is the first 1000 days of life, with growth faltering having proximal effects on child morbidity and mortality, and work productivity in adulthood.2 Poor feeding practices can adversely impact the health and nutritional status of children, which in turn have direct consequences for their mental and physical development. Furthermore, in malaria and HIV endemic countries, those infections impaired child immune system with a negative impact on nutritional status.3,4
Nutrients, essential for child growth and development, come from a diet composed of different food items. Dietary diversity (DD), defined as the sum of food groups consumed over a period of 24 hours, is an easy-to-measure key indicators used by the World Health Organization (WHO) to assess child feeding practices.5 DD has been long documented as a valid and reliable indicator of dietary adequacy6 and an useful predictor of dietary quality among infants and young children.7,8 Higher DD has been positively associated with nutrient intake,9 micronutrient intake and adequacy10 and child nutritional status.11 Contrary, poor DD, that is a hallmark of poverty, has been associated with growth faltering and all form of child malnutrition,12 more especially in rural contexts.13 Lower DD is particularly critical during the complementary feeding period, when essential nutrients for normal physical and mental development are most needed.14
In sub-Saharan Africa, many children cannot achieve healthy dietary diversity, particularly among vulnerable households. Lack of mother’s knowledge in adequate feeding practices has been also described as one of the causes of inadequate children diets, reflecting in to poor food quality and frequency. The monotony of diet is not just dreary, it results in poor nutrition and health.15
Supplementary feeding programs (SFPs) are effective in the community-based management of child malnutrition since incorporate nutrition-specific goals and actions to address the immediate determinants of child nutrition and development: adequate food and nutrient intake, caregiving and parenting practices in complementary feeding, dietary supplementation and diversification, access to health services and safe/hygienic environment for lowing the burden of infectious diseases.16,17 SFPs are more successful when integrating cooking demonstrations, food handouts and nutritional counseling with tailored messages on child complementary feeding.18 Scaling-up community-based programs for malnutrition and integrating nutritional activities aimed at improving infant and young child feeding (IYCF) practices would reduce the overall burden of childhood mortality and substantially reduces existing disparities.19
The Case of Zambia
Although the proportion of Zambian people living in extreme poverty has declined in the past decade, the country has not achieved the Millennium Development Goal 1 (MDG1) of eradicate extreme poverty and hunger by 2015,20 with lack of progress or deterioration reflecting in more than 45% of the population being undernourished.21 Climate changes and weather variability have increased the occurrence of droughts and flooding, threatening the mainly rain-fed agricultural production and consumption.22 In Zambia staple food typically consists in a plant-based meal: maize accompanied with seasonal vegetables, and few animal-sources food. It is not only insufficient in food quantity but also poor in dietary quality. 23
Under-five children are most vulnerable to this conditions, especially during complementary feeding period. The most recent Zambian Demographic Survey reports that only 11% of children (6-23 months old) are fed in accordance with IYCF practices, with 42% consuming a minimum of 3 meals/day and 22% having a minimum dietary diversity of 4 food groups. Children of mothers with a secondary education or higher, and children in the richest households, are most likely to be fed according to the recommended IYCF practices.24
The basic determinants of health are still in a critical state in Zambia. Limited access to water and sanitation facilities accompanied by poor hygiene is associated with skin diseases, acute respiratory infections (ARIs), and diarrhoeal diseases, the leading of preventable diseases. In 2012 the mortality rate attributed to exposure to unsafe water, sanitation and hygiene (WASH) services was 24.5 per 100 000 population.25
In 2015 only 65% of the Zambian population was using improved drinking-water source,26 with greater access for households in urban areas than households in rural areas (86% vs 51%).27 The most common improved source of drinking water was piped water (41%), especially in urban areas; while especially in rural area, the most common unimproved source of drinking water was unprotected dug well (21%). Adding chlorine was the most common treatment method (24%), followed by boiling water prior to drinking (15%). Households that do not treat drinking water accounted for 66%, with rural households more likely not to treat water before drinking compared with urban areas (78% vs 50%).24
Materials and Methods
The current study presents data of a cohort of Zambian under-five malnourished children assisted from 2015 to 2016 in the Rainbow Project SFPs (under Association Pope John 23rd) in Ndola area. On a weekly basis, Rainbow Project SFPs included routinely nutrition-specific activities (anthropometric assessment, on-site feeding, cooking demonstrations, food handouts: local food – maize flour, beans, groundnuts, sugar, oil and fortified blended foods – high energy protein supplement/HEPS), coupled by nutrition-sensitive interventions (nutritional counseling and health education, home visits). Details of SFPs activities have been previously described.28
For this study only information of children meeting the following criteria were considered: older than 12 months of age, not breastfed, HIV uninfected, nutritionally rehabilitated (outcome cured). All those children needed to have nutritional questionnaires filled both at baseline (T1) and follow up (T2). T1 coincided with admission to SFP and T2 coincided with discharge from SFP. The impact of the nutritional intervention was assessed by evaluating anthropometric data and dietary characteristic and feeding habits both at admission and discharge.
Anthropometric Assessment and Follow Up
Pediatric information (socio-demographic and anthropometric data) was routinely collected and entered in a database, with removal of personal identifiers.
Anthropometric assessment of malnutrition included measurement of weight and mid-upper arm circumference (MUAC), and presence of bilateral pitting edema.
According to the most updated WHO guidelines29 and the Integrating Management of Acute Malnutrition (IMAM) guidelines of the Zambian Ministry of Health for children aged 6 to 59 months,30 severe acute malnutrition (SAM) was defined when MUAC ≤ 11.5 cm (marasmus), and/or presence of bilateral pitting edema (kwashiorkor); moderate acute malnutrition (MAM) was defined when MUAC between 11.5 and 12.5 cm; underweight was defined as weight-for-age z-score (WAZ) <-2.31 More details on Rainbow SFPs anthropometric assessment and discharge criteria have been described elsewhere.32
Nutritional Assessment and Counseling
Information on children’s diet was collected both at T1 and T2, during a structured interview administered by a local nutritionist in face-to-face with the mothers/guardians. The questionnaire included dietary habits (appetite, number of daily meals), as well as access to drinking-water and hygiene practices. A semi-quantitative 24-hours food recall reported the food consumed the previous day by the child. Portion sizes were assessed by asking the respondents to describe in greater detail using standardized household measures (spoonfuls, cupfuls, etc). These amounts were later transformed into food weights and quantities of ingredients used to prepare mixed recipes, to estimate dietary intakes. Total energy and macronutrient intakes (carbohydrates, fats, protein) were calculated using NutVal (Version 4.1).33 Consumption of specific products for nutritional rehabilitation (ready-to-use therapeutic food - RUTF, fortified blended food/HEPS) was also taken in count.
According to national Zambian guidelines, nutritional counseling included principles for feeding young children at home with family food,34 complemented with dietary recommendation for the rehabilitation of malnutrition.30 Dietary recommendation focused on locally available foods was performed by using tools for community nutrition workers: a booklet35 in conjunction with growth-promotion infant and young child feeding (IYCF) counseling card.36
Nutritional counseling included:
- drinking-water source and treatment
- food hygiene
- hands hygiene
- food groups and dietary diversity
- food frequency (at least 5 meals a day)
- healthy and balanced meal containing three main ingredients: energy (staple food –maize), body-building (protein-source foods: beans, groundnuts, meat, eggs, small dried fish - kapenta) and protective food (vegetables, fruits)
- daily fruit and vegetables consumption (at least three portions).
Specific nutrition recommendation included the explanation of HEPS recipe and portions to be daily consumed, prescribed according to child’s age. Children with SAM were also sent to collect RUTF from the out-patient therapeutic program (OTP), when programs were integrated in the local clinic and RUTF was available.
In addition, generally health talks on the importance of balanced diet, hygiene, prevention of infections and diseases were performed.
Assessment of Dietary Diversity
The dietary diversity was defined based on 24-hour food recall. Since there is still no international consensus on which food groups to include in the calculation of the dietary diversity at the individual level and it could be adapted to the local context, for our analysis we considered 12 different food groups: cereals; tubers and roots; beans/pulses; nuts/seeds; milk/dairy products; meat/poultry; fish; eggs; fruits; vegetables; oils/fats; sugar.37 A score of 1 was assigned if a child ate 1 or more foods from a given food group, and a score of 0 if not. A minimum of 10 grams consumption for food was required to be counted in the group. The score values were then summed up for all food groups to create dietary diversity scores (DDS), which ranged from 0-12. Dietary adequacy was given to a goal of 7 scoring points, considering that at T2 at least 4 groups (cereals, oil, sugar, soya beans) could be provided within the supplementary food (HEPS) prescribed as part of the nutritional rehabilitation. Children with scores below 7 were classified to have poor dietary diversity; those with scores equal or above 7 to have good dietary diversity.
The daily dietary intakes were compared to age- and gender-specific Required Daily Amount (RDA) of WHO/FAO/ONU for energy38 and protein.39
Average children energy requirements and safe levels of intake for protein were also compared with FAO recommendation of Human Nutrition in developing World, considering a diet containing a great deal of cereals and pulses (therefore high in fiber), and little complete animal-origin protein.40 A consumption of less than 75% of the recommended intake for energy and protein was considered inadequate.
Micronutrients intake was not considered in this analysis since all the children were consuming fortified food as part of the nutritional rehabilitation, so micronutrient adequacy could be not accurate.41
Statistical Analysis and Ethical Considerations
Data were analyzed using SPSS software system 21.0 (IBM, Somers, NY, USA). Weight-for-age z-scores (WAZ) and MUAC-for-age z-scores (ZMUAC) were calculated using the WHO Anthro Software (Version 3.2.2, January 2011, WHO, Geneva, Switzerland),42 and ENA (Emergency Nutrition Assessment) Software (Version 2011, July 31st, 2012).43
Descriptive data and variables measured were presented as means with standard deviations (SD). Non-parametric tests for related samples (Wilcoxon Signed-Rank Test) were used to evaluate differences on feeding habits and dietary characteristics from baseline to follow up, and McNemar’s test was performed to examine the effect of nutritional counseling on food groups consumption. Mann-Whitney U Test for independent samples was used to investigate the association between dietary diversity scores at follow up (DDS_T2) and response in nutritional rehabilitation. The significance level was set at p<0.05.
This analysis is part of the study approved by the Tropical Diseases Research Centre (TDRC) Ethics Committee of Ndola, Zambia (IRB registration number 00002911).
Results
Data of a cohort of 37 malnourished children (62.2% male) were analyzed. All the children recovered from malnutrition, with a mean length of stay in the nutrition program of 11.3 ± 6.2 weeks. Socio-demographic, health and anthropometric characteristics of the sample at baseline are shown in Table 1.
Table 1. Socio-demographic, health and anthropometric characteristics at baseline
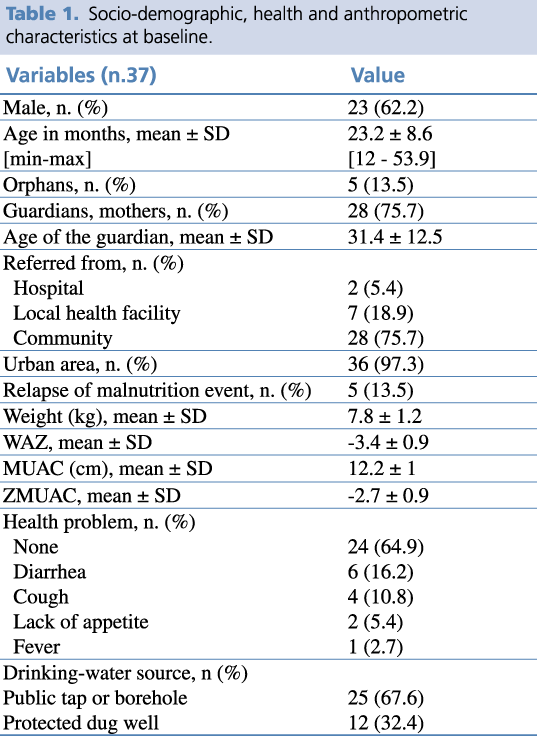
The mean age in months of children was 23.2 ±8.6 SD. The majority of children came from urban areas (97.3%) and were referred to the Rainbow SFPs from the community (75.7%).
More than half of the sample did not have any health problems at admission (64.9 %), while among the others diarrhea was the most represented health complain (16.2%).
Figure n.1 illustrates the distribution of different type of malnutrition, by age and sex at baseline. Almost half of the children were admitted in Rainbow SFPs because of SAM. Youngest children were in most critical nutrition condition, with nearly 38% being affected by kwashiorkor. Nearly 35% of the sample was admitted because of MAM, and about 16% of children were underweight.
Figure 1. Classification of malnutrition by age and sex at baseline
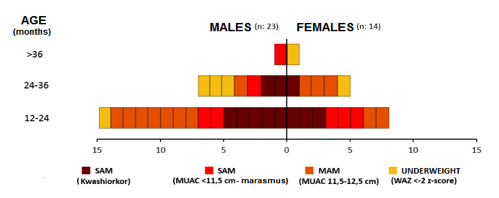
Table n. 2 shows the dietary characteristics of children at admission and discharge. Analysis of 24-hour food recalls underlies significant changes in terms of dietary diversity and number of daily meal from baseline to follow-up, respectively before and after nutritional counseling was performed.
Table 2. Dietary characteristics of children at baseline (T1) and follow-up (T2)
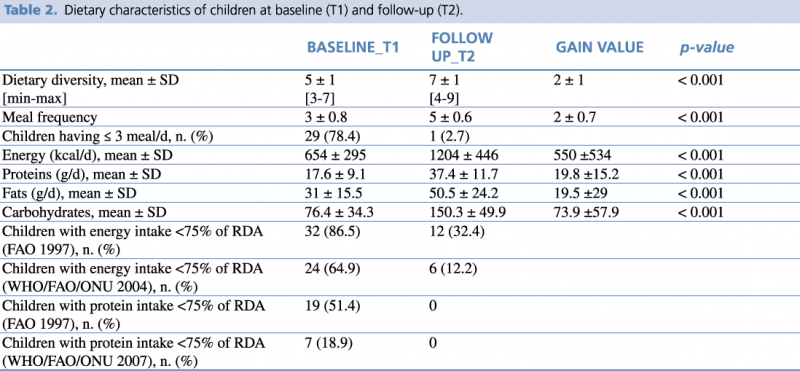
The dietary interview conducted prior to nutritional counselling, revealed a DD on admission quite low (5 ± 1SD), while it increased at follow-up (7± 1SD), representing a statistically significant difference (p<0.001). It is interesting to note also the significant increase in the mean number of meals, which rose from 3 to 5 meals per day on average.
The percentage of children having ≤ 3 meals/day, that can be defined a critical but very common practice,44 declined from nearly 79% to less than 3%. We underlie that 5 meals a day is the gold standard for children recommended in national and international guidelines.33
The average intake of energy and most nutrients was much lower than International recommendation, especially at baseline. For comparative analysis of the dietary composition, a statistically significant rise in the intake of energy and all macronutrients was observable from T1 to T2. At follow-up, 32.4% of children were still receiving less than 75% of the daily recommended energy per WHO/FAO/ONU guidelines,37 while the percentage decreased to 12.2% per FAO guidelines.39 All children received at least 75% of the protein allowance at that time point.38
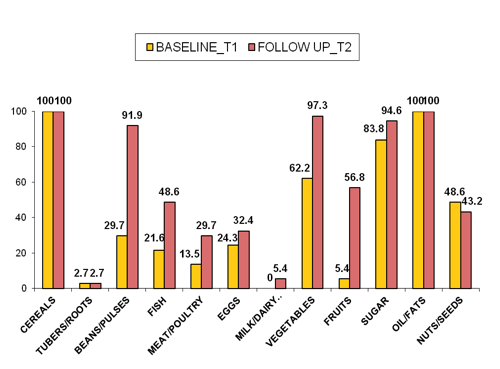
Figure n.2 shows food groups eaten from children at T1 and at T2. One of the major evident nutritional problems at baseline was that children had a monotonous diet, with energy food (cereals, oil and sugar) mainly represented, and poor protein-source food (mostly plant origin such as nuts). Statistically significant changes in food groups consumption were noted at T2, after nutritional counseling. The number of children consuming animal-sources food (fish, eggs, meat/poultry) increased generally by 35% (p=0.004), and respectively by 27% (p=0.031), 8% (NS; p=0.607) and 16% (NS; p=0.180). A consistent improvement in consumption of food plant origin was noted: +35% for vegetables and +50% for fruit (p<0.001). The important achievement in animal-source foods and vitamin-rich foods consumption can be considered a direct result of nutritional counseling and education, since Rainbow SFPs did not include this food type in food handouts. Furthermore, supplementary foods were not observed to be substituted for typical local food offered in the home. These results are in line with those of recent studies that also detected no negative impact of supplementary food on the consumption of typical complementary foods.45
Figure 2. Changes in food groups consumption from T1 to T2
In Table n.3 we investigated the association between DDS and type food group consumed at baseline and follow up. DDS_T1 underlined that children were fed only a limited number of food groups, with a range of score from 3 to 7. Cereals, oil and sugar were the mainly represented food source, independently from the dietary diversity score. Fruit group consumption was very poor in central DD score. More than half of children ate vegetables, since at the basis of local diet to accompany the staple food.
Table 3. Changes in trends of food group consumption, numbers of daily meals and animal-source protein by DDS from T1 to T2
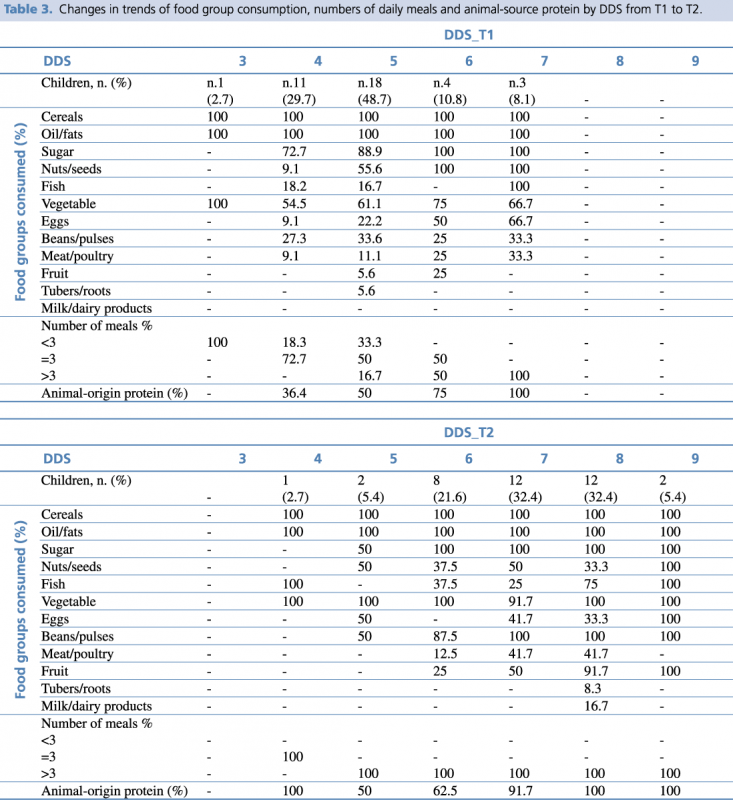
Low DDS_T1 showed general lack of protein, starting at diversity scores of 4. Animal-sources food were few consumed in low DDS_T1, while rose with increasing of the score (50% of children with score=5). None of the children had milk or dairy products.
In DDS_T2 cereals, oil and sugar remained the main food groups consumed, for all the DD scores. Fruit group started to be considerably eaten by more than half of the sample with DDS≥7. A relevant increase in food protein consumption (both animal and plant protein) was found in DDS_T2, even starting at low scores. Only few children had milk/dairy products when DDS_T2 = 8, reflecting that milk is not locally considered as an aliment for children. Vegetable group was mostly represented for all the DDS_T2.
As an important part of the nutritional counseling, good emphasis was also given to water source and treatment. Significant improvements in treating drinking-water by boiling it (p< 0.001) were noticed from baseline to follow up (18.9% vs 72.9%).
Finally, Mann-Whitney U Test for independent samples was performed in order to test the hypothesis that changes in DDS after nutritional counseling could be associated with response in nutritional rehabilitation. The variable of DDS_T2 was dichotomized (0=DDS_T2 ≤7; 1= DDS_T2 >7) and correlated with changes in anthropometric measurements and gain in z-scores. High dietary diversity scores (DDS_T2 >7) were positively correlated with gain in MUAC-for-age z-scores, expressed as gain in standard deviations (p=0.046). No other statistically significant associations were found.
Discussion
Feeding practices play a pivotal role in determining the optimal physical growth, development and health of infants and young children. Unfortunately, Zambian diet is often monotonous, highly insufficient and inadequate, exposing vulnerable children to growth faltering and malnutrition. At admission in Rainbow SFPs children’s diet resulted to be very poor, with a lack in dietary diversity, energy and macronutrient deficits, and inappropriate feeding practices that could have been contributed to child malnutrition. Our study findings imply that efforts to promote optimal child feeding practices with behavior change communication should not be underestimated in resource-limited settings. Dietary consumption and feeding practices have been significantly improved after nutritional counselling was integrated as a routinely activity of nutritional rehabilitation. Our results are consistent with those of other studies highlight the complexity of nutritional rehabilitation efforts in community-based programs for management of malnutrition, when food insecurity and infectious diseases such as HIV and malaria coexist in a vicious circle.46,47,48
Nutritional assessment, monitoring and evaluation is therefore one of the key to improve children diet, not only in terms of energy and nutrients, but also in terms of dietary diversity. Our results point to the effectiveness of nutritional counseling when integrated within community-based programs against malnutrition, suggesting the need of enhancing nutritional education with an emphasis on a culturally appropriate balanced diet.
Limitations of the Study
The first limitations of the present study included the small convenience-based sample and the use of semi-quantitative questionnaire to estimate amounts of foods consumed and nutrient composition data. Being derived from single 24-hours recalls, our estimates of dietary intakes are subject to random error as a consequence of within-subject variation. Being more specific on types of food consumed and integrating a food frequency assessment questionnaire could improve dietary estimations. Food recall of mothers/guardian could be also facilitated using an atlas with pictures of specific quantities of local food. Since all the children were consuming fortified foods during nutritional rehabilitation, micronutrients intake and adequacy could not be evaluated. Further study can be done with large sample size, longer intervention period and more strong design to confirm consistency of result.
Acknowledgments
We acknowledge with gratitude all the children and their guardians assisted in SFPs during these years of work. We thank the Association Pope John the 23rd and all the operators and volunteers of NGOs/CBOs involved in the nutritional program for their tremendous job in the community. We thank the nutritionist Kanungwe Ndhlovu and the community volunteer Maxildah Mushoke, who helped in data collection in the field. We are particularly grateful to Elisabetta Garruti and Gloria Gozza for project management, guidance and support. We would also like to thank all the Ndola District Health Office for the constant support and advice.
References
- United Nations Children’s Fund: Strategy for Improved Nutrition of Children and Women in Developing Countries. New York: UNICEF; 1990. http://www.ceecis.org/iodine/01_global/01_pl/01_01_other_1992_unicef.pdf (accessed June 23, 2017).
- Black RE, Victora CG, Walker SP, Bhutta ZA, Christian P, de Onis M, et al.: Maternal and Child Undernutrition and Overweight in Low-Income and Middle-Income Countries. Lancet 2013; 382:427–51.
- Arpadi SM: Growth Failure in HIV-Infected Children. WHO Consultation on Nutrition and HIV/AIDS in Africa: Evidence, Lessons and Recommendations for Action, Durban, South Africa, 10–13 April 2005. Geneva: WHO; 2005.
- Scarcella P, Moramarco S, Buonomo E, Nielsen-Saines K, Jere H, Guidotti G,et al.: The Impact of Malaria on Child Growth: Anthropometric Outcomes in a Pediatric HIV-Exposed Cohort in Malawi. Biomedicine & Prevention 2016; 1: 28-33. http://www.biomedicineandprevention.com/manuscript/impact-malaria-child-growth-anthropometric-outcomes-pediatric-hiv-exposed-cohort-malawi (accessed June 23, 2017).
- WHO: Indicators for Assessing Infant and Young Child Feeding Practices. Part II: Measurement. Geneva: WHO; 2009.
- Food and Nutrition Technical Assistance (FANTA). FANTA Project. Working Group on Infant and Young Child Feeding Indicators. Developing and Validating Simple Indicators of Dietary Quality and Energy Intake of Infants and Young Children in Developing Countries: Summary of Findings from Analysis of 10 Data Sets. Washington: Academy for Educational Development; 2006.
- Moursi MM, Arimond M, Dewey KG, Trèche S, Ruel MT, and Delpeuch F: Dietary Diversity is a Good Predictor of the Micronutrient Density of the Diet of 6- to 23-Month-Old Children in Madagascar. The Journal of Nutrition Community and International Nutrition 2008; 138(12): 2448-53.
- Ruel M T: Is Dietary Diversity an Indicator of Food Security or Dietary Quality? A Review of Measurement Issues and Research Needs. Food Nutr Bull. 2003; Jun; 24(2):231-2.
- Nti CA: Dietary Diversity Is Associated with Nutrient Intakes and Nutritional Status of Children in Ghana. Asian Journal of Medical Sciences. 2011; 2:105–9.
- Steyn NP, Nel JH, Nantel G, Kennedy GL, Labadarios D: Food Variety and Dietary Diversity Scores in Children: Are They Good Indicators of Dietary Adequacy? Public Health Nutr. 2006; 9: 644–50.
- Arimond M, Ruel MT: Dietary Diversity Is Associated with Child Nutritional Status: Evidence From 11 Demographic and Health Surveys. J Nutr. 2004; 134:2579–85.
- Marriott B, White A, Hadden L, Davies JC, Wallingford JC. World Health Organization Infant and Young Child Feeding Indicators: Associations with Growth Measures in 14 Low-Income Countries. Matern Child Nutr. 2012; 8:354–70.
- Busert LK, Neuman M, Rehfuess EA, Dulal S, Harthan J, Chaube SS, et al.: Dietary Diversity Is Positively Associated with Deviation from Expected Height in Rural Nepal. Journal of Nutrition. 2016; 146(7): 1387-1393.
- Amugsi DA, Mittelmark MB, Lartey A: Dietary Diversity is a Predictor of Acute Malnutrition in Rural but Not in Urban Settings: Evidence from Ghana. British Journal of Medicine and Medical Research 2014; 4(25): 4310–24.
- Golden MHN: The Nature of Nutritional Deficiency in Relation to Growth Failure and Poverty. Acta Paediatr Scand. 1991; 374(Suppl):95–110.
- Somassé YE, Bahwere P, Laokri S, Elmoussaoui N, Donnen P: Sustainability and Scaling-Up Analysis of Community-Based Management of Acute Malnutrition: Lessons Learned from Burkina Faso. Food Nutr. Bull. 2013; 34: 338–348.
- Ashworth, A.: Efficacy and Effectiveness of Community-Based Treatment of Severe Malnutrition. Food Nutr. Bull. 2006; 27: S24-S4.
- Ashworth A, Ferguson E: Dietary Counseling in the Management of Moderate Malnourishment in Children. Food Nutr. Bull. 2009; Sep; 30(3 Suppl):S405-33.
- Bhutta ZA, Das JK, Rizvi A, Gaffey MF, Walker N, Horton S, et al.: Evidence-Based Interventions for Improvement of Maternal and Child Nutrition: What Can Be Done and at What Cost? Lancet. 2013; 382:452–77.
- United Nations Development Programme. Millennium Development Goals Progress Report Zambia 2013. Lusaka: UNDP, 2013. http://www.zm.undp.org/content/dam/zambia/docs/mdgs/MDG%20Report%202013.pdf (accessed June 12, 2017).
- FAO, IFAD and WFP: The State of Food Insecurity in the World 2015. Meeting the 2015 International Hunger Targets: Taking Stock of Uneven Progress. Rome: FAO, 2015. http://www.fao.org/3/a-i4646e.pdf (accessed June 20, 2017).
- Developmental Food Aid and Food Security Assistance in Zambia 2000–2012. http://www.openaiddata.org. (accessed June 17, 2017).
- Zhang Z, Goldsmith PD, Winter-Nelson A:The Importance of Animal Source Foods for Nutrient Sufficiency in the Developing World: The Zambia Scenario. Food and Nutrition Bulletin 2016, 37 (3): 303-316.
- Central Statistical Office (CSO) [Zambia], Ministry of Health (MOH) [Zambia], and ICF International: Zambia Demographic and Health Survey 2013-14. Rockville, Maryland, USA: Central Statistical Office, Ministry of Health, and ICF International, 2015. https://www.dhsprogram.com/pubs/pdf/FR304/FR304.pdf. (accessed June 23, 2017).
- World Health Statistics 2017: Monitoring Health for the SDGs, Sustainable Development Goals. Geneva: WHO; 2017. Licence: CC BY-NC-SA 3.0 IGO. http://www.who.int/gho/publications/world_health_statistics/2016/en/. (accessed June 21, 2017).
- WHO/AFRO Library Cataloguing: Atlas of African Health Statistics 2016: Health Situation Analysis of the African Region. WHO Regional Office for Africa, 2016
- UNICEF and World Health Organization: Progress on Sanitation and Drinking Water – 2015 Update and MDG Assessment. WHO Library Cataloguing-in-Publication Data. https://www.wssinfo.org/fileadmin/user_upload/resources/JMP-Update-report-2015_English.pdf. (accessed June 13, 2017).
- Moramarco S, Amerio G, Gozza Maradini G, Garuti E: Rainbow project: A Model to Fight Child Malnutrition in Zambia. In Turning Rapid Growth into Meaningful Growth: Sustaining the Commitment to Nutrition in Zambia; Harris, J., Haddad, L., Grütz, S.S., Eds.; Publisher: IDS, Brighton, UK, 2014: 57–61.
- WHO Guideline: Updates on the Management of Severe Acute Malnutrition in Infants and Children. Geneva: World Health Organization; 2013. http://apps.who.int/iris/bitstream/10665/95584/1/9789241506328_eng.pdf?ua=1 (accessed June 18, 2017).
- Zambian Ministry of Health: DRAFT Integrated Management of Acute Malnutrition Zambia Guidelines; Zambian Ministry of Health. Lusaka, Zambia; 2012.
- WHO. WHO Child Growth Standards: Length/Height-for-Age, Weight-for-Age, Weight-for-Length, Weight-for-Height and Body Mass Index-for-age: Methods and Development. Geneva: WHO 2006. http://www.who.int/childgrowth/standards/Technical_report.pdf (accessed June 15, 2017).
- Moramarco S, Amerio G, Ciarlantini C, Kasengele Chipoma J, Kakungu Simpungwe M, Nielsen-Saines K, et al.: Community-Based Management of Child Malnutrition in Zambia: HIV/AIDS Infection and Other Risk Factors on Child Survival. Int. J. Environ. Res. Public Health 2016; Jul 1;13(7).
- United Nations High Commissioner for Refugees (UNHCR), United Nations Children’s Fund (UNICEF), World Food Programme (WFP), World Health Organization (WHO): Food and Nutrition Needs in Emergencies. 2002. http://apps.who.int/iris/bitstream/10665/68660/1/a83743.pdf. (accessed June 23, 2017).
- Zambia Ministry of Health, National Food and Nutrition Commission of the Republic of Zambia: Infant and Young Child Feeding Counselling: an Integrated Course. 2008. http://iycn.wpengine.netdna-cdn.com/files/IYCN-Zambia-participant-062711.pdf. (accessed June 16, 2017).
- National Food and Nutrition Commission: Improved Complementary Foods Recipe Booklet. Family Foods for Breastfed Children in Zambia. Lusaka: National Food and Nutrition Commission, Government of the Republic of Zambia/Food and Agriculture Organization, 2007. http://www.fao.org/docrep/010/ ai208e/ai208e00.htm. (accessed June 10, 2017).
- UNICEF: Infant and Young Child Feeding Counseling Card. 2012. https://www.unicef.org/nutrition/files/counseling_cards_Oct._2012small.pdf (accessed June 10, 2017).
- Kennedy G, Ballard T, Dop MC: Guidelines for Measuring Household and Individual Dietary Diversity. Rome: FAO and UN; 2012. http://www.fao.org/docrep/014/i1983e/i1983e00.pdf. (accessed June 16, 2017).
- WHO/FAO/ONU: Human Energy Requirements. Report of a Joint FAO/WHO/UNU Expert Consultation. Rome: Food and Agricultural Organization; 2004.
- WHO/FAO/ONU: Protein and Amino Acid Requirements in Human Nutrition. WHO Technical Report Series 935. Geneva: WHO; 2007.
- Michael C, Latham: Human Nutrition in Developing World. Rome: FAO Food and Nutrition Series; 1997.
- Mallard SR, Houghton LA, Filteau S, Chisenga M, Siame J, Kasonka L, et al.: Micronutrient Adequacy and Dietary Diversity Exert Positive and Distinct Effects on Linear Growth in Urban Zambian Infants. J Nutr. 2016 Oct; 146(10):2093-2101.
- WHO Anthro for Personal Computers, Version 3.2.2, 2011: Software for Assessing Growth and Development of the World's Children. Geneva: WHO, 2010 (http://www.who.int/childgrowth/software/en/). (Accessed on 07 July 2017).
- SMART Emergency Nutrition Assessment for Standardized Monitoring and Assessment of Relief and Transitions (ENA for SMART). http://www.nutrisurvey.de/ena2011/. (accessed June 14, 2017).
- Mallard SR, Houghton LA, Filteau S, Mullen A, Nieuwelink J, Chisenga M, et al.: Dietary Diversity at 6 Months of Age Is Associated with Subsequent Growth and Mediates the Effect of Maternal Education on Infant Growth in Urban Zambia. J Nutr 2014; 144:1818–25.
- Campbell RK, Hurley KM, Shamim AA, Shaikh S, Chowdhury ZT, Mehra S, et al.: Effect of Complementary Food Supplementation on Breastfeeding and Home Diet in Rural Bangladeshi Children. Am J Clin Nutr 2016; 104:1450–8.
- Buonomo E, De Luca S, Tembo D, Scarcella P, Germano P, Doro Altan AM, et al.: Nutritional Rehabilitation of HIV-Exposed Infants in Malawi: Results from the Drug Resources Enhancement against AIDS and Malnutrition Program. Int. J. Environ. Res. Public Health 2012, 9: 421–434.
- Daba AK, Ersado ME: Impact of Community Based Management of Acute Malnutrition Integrated Nutrition Education on Infant and Young Child Feeding Knowledge and Practice of Mothers or Caregivers in Dilla Zuria Woreda, Southern Ethiopia: A Quasi Experimental Study. Fam Med Med Sci Res 2015, 4: 190.
- Kang Y, Suh YK, Debele L, Juon HS, Christian P: Effects of a Community-Based Nutrition Promotion Programme on Child Feeding and Hygiene Practices among Caregivers in Rural Eastern Ethiopia. Public Health Nutr 2017, 20(8):1461-1472.